
Employment
Data
Employment Record
2023
Here we provide information about the track record of Gakushuin University graduates (Class of March 2021) in finding employment.
Our high successful job-seekers rate is supported by the robust academic skills, broad perspective that our students cultivate through their classes,
and a wide variety of career/job seeking support, which provides empathic consultation to each student.
Successful Job-seekers Rate
98.1%
※National average97.3%
-
ICT
-
Service Industry
-
Finance
-
Civil Service
-
Education
-
 Mass Communications
48
-
 Civil Service
118
-
 Business Start-ups
7
※Mass communications includes work in broadcasting, newspapers, publishing and advertising
Ratio of Jobs by Industry at Each Faculty
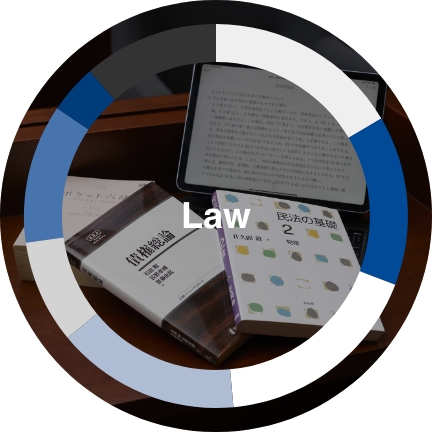
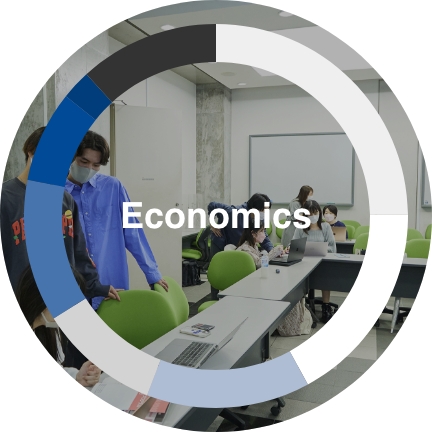

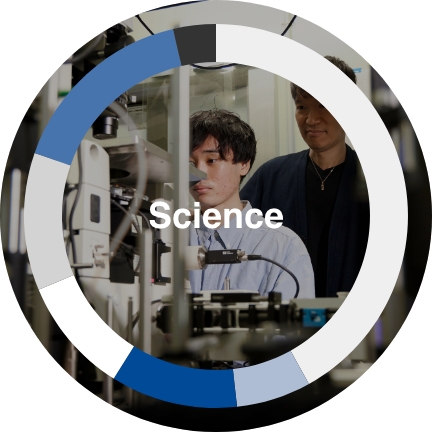
- Finance
- ICT
- Wholesale
- Service Industry
- Manufacturing
- Education
- Civil Service
- Others
Employment Rate by Gender
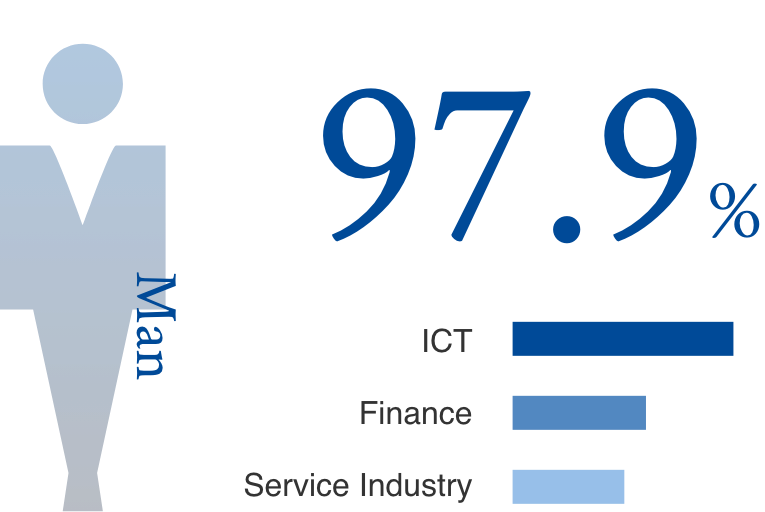
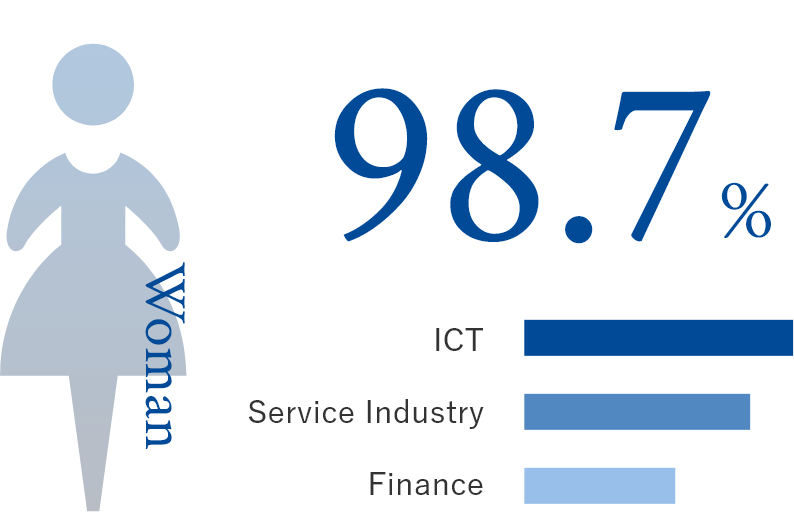
※Top Three Industries by Ratio of Jobs Found for Men and Women
ICT 25.5%,Finance 15.4%,Service Industry : 12.9%
ICT 18.6%,Service Industry 17.8%,Finance 14.3%
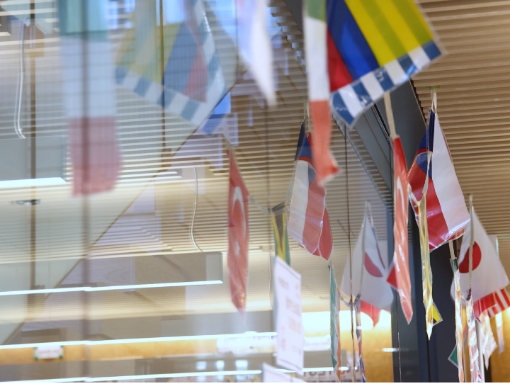
Alumni Living and Working around the World
48COUNTRIES
※Number of Countries and Regions where Graduates Registered with the Gakushuin Alumni Association “Ouyukai” Are Residing (as o f J une 30, 2023)
Job-seeking Support
100PROGRAMS
Main programs
- Interview technique
- Research workshops by industry
- Research workshops by occupation ...and more
Number of alumni assisting with job-seeking programs =
242
Job-seeking record
Job-seeking record
| Graduates | Job-seekers | Percentage of job-seekers | Successful job-seekers | Successful job-seekers rate | ||||||
|---|---|---|---|---|---|---|---|---|---|---|
| Male | Female | Male | Female | Male | Female | Male | Female | Male | Female | |
| Department of Law | 126 | 121 | 106 | 110 | 84.1 | 90.9 | 104 | 106 | 98.1 | 96.4 |
| Department of Political Studies | 110 | 117 | 97 | 107 | 88.2 | 91.5 | 95 | 107 | 97.9 | 100 |
| Department of Economics | 147 | 109 | 131 | 103 | 89.1 | 94.5 | 126 | 101 | 96.2 | 98.1 |
| Department of Management | 129 | 114 | 115 | 103 | 89.1 | 90.4 | 113 | 102 | 98.3 | 99.0 |
| Department of Philosophy | 35 | 60 | 24 | 49 | 68.6 | 81.7 | 23 | 46 | 95.8 | 93.9 |
| Department of History | 52 | 36 | 38 | 30 | 73.1 | 83.3 | 38 | 30 | 100 | 100 |
| Department of Japanese Language and Literature | 39 | 73 | 29 | 64 | 74.4 | 87.7 | 27 | 64 | 93.1 | 100 |
| Department of English Language and Cultures | 29 | 79 | 27 | 72 | 93.1 | 91.1 | 26 | 72 | 96.3 | 100 |
| Department of German Studies | 13 | 37 | 13 | 33 | 100 | 89.2 | 13 | 31 | 100 | 93.9 |
| Department of French Cultural Studies | 8 | 61 | 7 | 50 | 87.5 | 82.0 | 7 | 48 | 100 | 96.0 |
| Department of Psychology | 24 | 65 | 16 | 51 | 66.7 | 78.5 | 16 | 51 | 100 | 100 |
| Department of Education | 14 | 36 | 11 | 29 | 78.6 | 80.6 | 11 | 29 | 100 | 100 |
| Department of Physics | 33 | 8 | 10 | 4 | 30.3 | 50.0 | 10 | 3 | 100 | 75.0 |
| Department of Chemistry | 22 | 20 | 14 | 9 | 63.6 | 45.0 | 14 | 9 | 100 | 100 |
| Department of Mathematics | 46 | 13 | 35 | 12 | 76.1 | 92.3 | 34 | 12 | 97.1 | 100 |
| Department of Life Science | 26 | 24 | 14 | 17 | 53.8 | 70.8 | 14 | 16 | 100 | 94.1 |
| Department of International Social Sciences | 66 | 124 | 58 | 113 | 87.9 | 91.1 | 58 | 112 | 100 | 99.1 |
| Total (by gender) | 919 | 1097 | 745 | 956 | 81.1 | 87.1 | 729 | 939 | 97.9 | 98.2 |
| Total (both genders) | 2016 | 1701 | 84.4 | 1668 | 98.1 | |||||
Top 15 Employers (total for all faculties)
| Name of company | Number of graduates hired | |
|---|---|---|
| 1st | Tokyo 23 City | 19 |
| 2nd | Gakushuin University | 14 |
| 2nd | Accenture Japan Ltd | 14 |
| 4th | The Chiba Bank, Ltd. | 12 |
| 5th | Nippon Life Insurance Company | 10 |
| 6th | Saitama Prefecture(Except for Saitama City) | 10 |
| 7th | SMBC Nikko Securities Inc. | 9 |
| 7th | Chiba Prefecture(Except for Chiba City) | 9 |
| 7th | Tokyo Metropolitan Board of Education | 9 |
| 10th | Chiba Prefecture Board of Education | 8 |
| 10th | Recruit Holdings Co., Ltd. | 8 |
| 10th | Saitama Prefecture Board of Education | 8 |
| 10th | Resona Holdings, Inc | 8 |
| 10th | Sumitomo Mitsui Trust Bank, Limited | 8 |
| 15th | Chuo Labour Bank | 7 |